 English
 Français
 Deutsch
 euskara
 Русский язык
 Italiano
 Português
 Nederlands
 Polski
 Greek
Greek Lietuva
 Türkçe
 日本語
日本語 한어
한어 中文
中文 தாமில்
 فارسی
فارسی हिंदी
हिंदी Tiếng Việt
 ภาษาไทย
 Pilipino
 Indonesia
 தாமில்
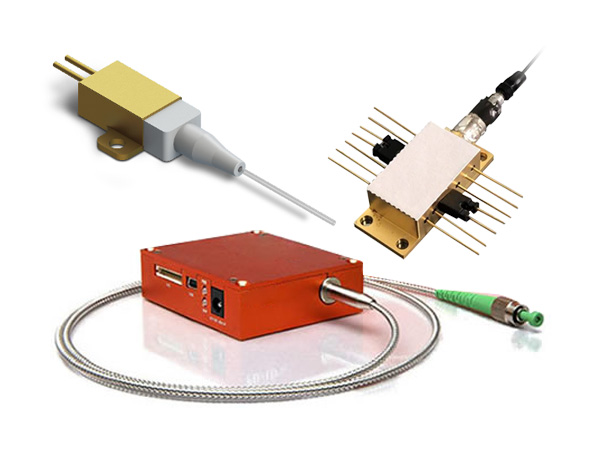

Spectral Fiber Sensors for Cancer Diagnostics
Cancer is one of the main causes of morbidity and mortality across the globe. Hence, attempts are focused on the early-stage detection of cancer, and optical spectroscopy has been largely used for early diagnosis of cancer.
Fluorescence or molecular spectroscopy techniques such as IR-absorption, Raman scattering, or diffuse reflection are employed for differentiating between malignant and healthy tissue. Raman spectroscopy has already been successfully used for the detection of skin cancer. Moreover, fluorescence, NIR, and MIR spectroscopy have exhibited incredible performance power in the detection of breast and cervical cancer. Yet, the integration of MIR and Raman spectroscopy into a single instrument is innovative and highly promising as those are complementary techniques.
Sample Preparation
Matched pairs of tumor and nearby non-tumor renal cortex tissues were acquired from kidneys of patients who underwent radical nephrectomy in the Klinik für Urologie, Charité—Universitätsmedizin Berlin.
MIR
The Matrix MF (Bruker) with MCT detector and the iS5 (Thermo Fisher Scientific) with DTGS detector FTIR spectrometers were used for performing the mid-infrared measurements. Two different ATR probes were used for recording the spectra in contact. Spectra in the region from 2600 to 3600 cm−1 were obtained using a probe that included chalcogenide infrared (CIR) fibers with zirconium dioxide tip (art photonics GmbH). A MIR-ATR probe with polycrystalline infrared (PIR) fibers and a silica tip (art photonics GmbH) was used for recording spectra in the fingerprint region.
Raman
A Ventana spectrometer (Ocean Optics) coupled with fiber optic probes was used for performing all the Raman experiments. A single fiber was used as the excitation channel and the detection channel, simultaneously, for spectra obtained in the high-wavenumber region (2600–3600 cm−1). A homemade coupler was used for coupling the laser working with 690 nm excitation (CNI Optoelectronics) into the 400 µm core fiber, thereby enabling delivery of laser light into the fiber and back to the spectrometer. A 785-nm excitation laser (Ocean Optics) was used for recording the measurements in the fingerprint region (600–1800 cm−1).
NIR
The portable fiber-optic NIRQuest InGaAs spectrometer (Ocean Optics) was operated in reflectance mode in the spectral range from 900 to 1700 nm to perform the NIR measurements. The spectrometer was connected with the probe and the light source through optical fibers and to a computer through the USB port.

Figure 1. Setup for NIR measurements. (1) NIR probe R (1 + 7) from art photonics GmbH, (2) tissue slice in petri dish, (3) NIRQuest spectrometer, (4) halogen lamp, and (5) PC with software for spectra collection.
Results and Discussion
MIR spectra recorded from cancer and non-cancer tissue display contributions from proteins, lipids, and other carbohydrates. Figure 2 illustrates the averaged spectra acquired from kidney samples. Signal intensities are comparable in the range of 1300–1800 cm−1. It is possible to assign the signals at 1740, 1460, and 1378 cm−1 to lipids. They are the result of C=O stretching, CH3 asymmetric bending, and CH3 symmetric bending vibrations, respectively. One can observe the Amide bands at 1650, 1560, and 1300 cm−1. Typical bands resulting from the phosphate group of phospholipids can be observed at 1085 and 1240 cm−1. The so-called phosphate group represents the phosphor-diester-linkage that occurs in phospholipids. Moreover, collagen and polysaccharides contribute to characteristic signals within this wavenumber range. The notable band around 1040 cm−1 is most probably caused by sugar molecules, which are also found in DNA.

Figure 2. Preprocessed spectra showing clear differences between cancerous and non-cancer samples
MIR spectra detailed so far were recorded in the fingerprint region of 900–1800 cm−1. The signals detected in this range of the spectrum are drawn from C=C and C=O stretching vibrations and also from skeletal and bending vibrations.
NIR spectrum consists of distinctive spectral signatures of components such as carbohydrates, lipids, phosphate, and proteins. Particular spectral regions exhibit higher variation in composition between tumor and normal tissues. These regions were highlighted with the help of mathematical preprocessing. Signal pretreatment was mainly performed to enhance data quality before modeling and to eliminate physical information from the spectra which can be considerably affected by nonlinearities brought about by light scattering. Deviations between the normal and cancer spectra were highlighted by subtracting the cancer mean spectrum.
The largest spectral differences between normal and cancer tissues were observed in the interval characteristic for the first overtones and combination vibrations of NH, OH, and CH bonds. A quite familiar fact is that when compared to normal tissues, cancer tissues have reduced carbohydrate level, and normal tissues have higher phosphate content than cancer tissues. Results show that the first and second overtones of the C-H vibrations and also the combination bands of NH, OH, and CH can serve as diagnostic markers for kidney cancer.
Moreover, when Raman spectroscopy was used, the differentiation between cancer and non-cancer samples appeared to be very straightforward. In contrast to the non-cancer samples which exhibited a very strong fluorescence covering nearly all Raman signals, cancer samples did not exhibit fluorescence.

Figure 3 illustrates a spectrum obtained from a kidney cancer sample. The signals in the lower wavenumber range display low intensities. Skeletal vibrations of amino acids are the reason behind the typical signals in this range. For instance, it is found that the C-S stretching mode of cysteine is around 660 cm−1. Raman bands exhibiting higher intensities are located at 1300, 1441, and 1660 cm−1. It is possible to assign these vibrations to CH2CH3 twisting, CH2 bending, and C=O stretching modes, respectively. While the first signal is caused by collagen or lipids, the last signal is derived from proteins and the remaining signal could be caused by both biomolecules.
Figure 3. Raman spectra obtained from one patient showing the differences between cancer and non-cancer samples for measurements in fingerprint and high wavenumber region. Signals can be detected more clearly after the subtraction of the fluorescence background (shown below). A 690-nm laser was used for exciting the Raman spectra in the high-wavenumber region. The behavior was the same as for the spectra obtained with 785 nm; when compared to the cancer samples, the fluorescence was higher for the non-cancer samples. In this region, it is possible to assign specific signals to vibrational modes of proteins, lipids, and water. Lipids exhibit distinct peaks at 2920 and 2850 cm−1 with respect to the anti-symmetric and symmetric CH2 stretching vibrations. Proteins lead to peaks at 2956 and 2870 cm−1 corresponding to the stretching vibrations of the CH3 group. The characteristic broad band for water is located at 3400 cm−1.
Conclusions
This article shows that differentiation between cancer and non-cancer tissues can be performed by using molecular spectroscopy and that the investigated techniques complement each other. This can be considered as a starting point in developing a multimodal instrument for cancer detection.
For more information on the probe, please click here.